A well known non-linear difference equation that exhibits chaos is the logistic map. It was extensively studied by the British ecologist Robert M. May. His work on its intricate dynamics was published as a paper in the June 1976 issue of Nature. It is characterized by the equation
xn+1 = a.xn (1 - xn) (1)
Here, xn denotes the value of the state in the nth iteration and is a real value in the interval [0,1]. Also, a is a real parameter in the interval [0,4]. The dynamics of the map can be studied by choosing a value for a, assigning an initial value x0 to the state and iterating repeatedly, to obtain the sequence x0, x1, x2, x3... Such a sequence of states is called an orbit.
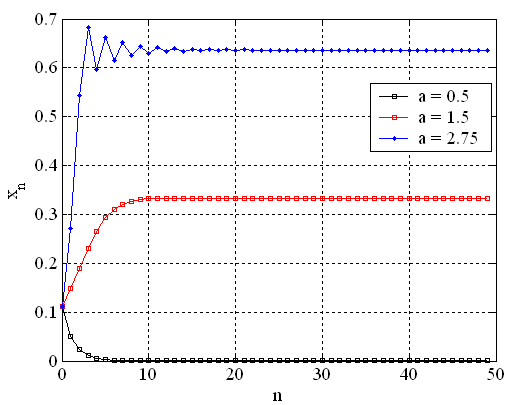
For a between 0 and 1, the orbit is found to converge to a fixed point x = 0. For every of a between 1 and 3, the system converges to a different non-zero point. This convergence to fixed points can be easily seen in a temporal plot of xn versus n.

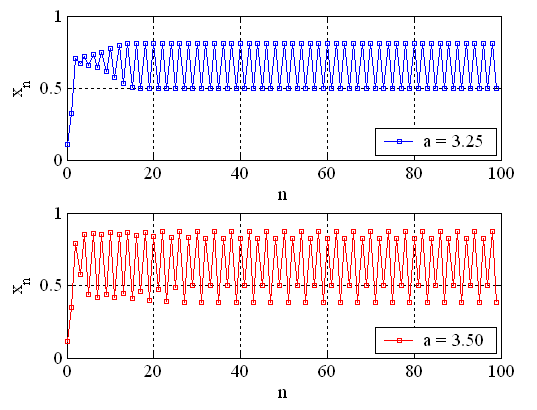
At a=3, the system undergoes what is known as a period-doubling bifurcation. It means that instead of settling to a fixed point, the system begins to oscillate between two states - a dynamics known as a 2-cycle. Further, if a is progressively increased up to about 3.57, the system undergoes a sequence of period-doubling bifurcations, encountering 4, 8, 16-cycles and so on up to infinity! This usually called a period-doubling cascade. The 2 and 4-cycles can again be seen easily as temporal plots. The blue plot is a 2-cycle and the red plot is a 4-cycle.
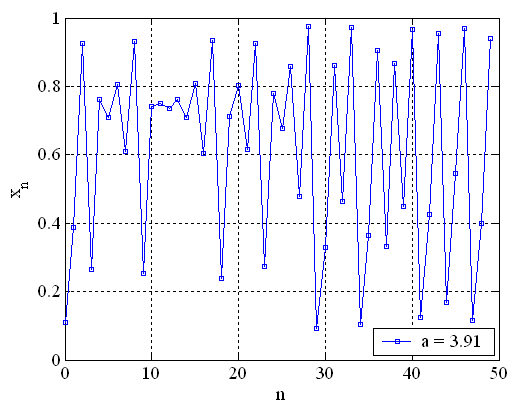
If the value of a is further increased, it is observed that the orbit neither converges to a fixed point nor oscillates between a finite number of states. Instead, it appears to behave erratically, without any apparent pattern over time. This state is called chaos. A chaotic trajectory is shown in the following temporal plot.
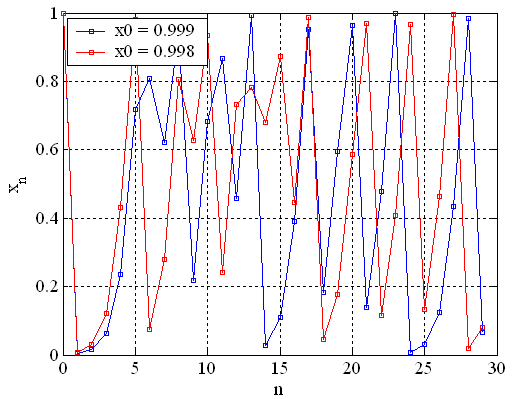
Chaotic systems are sensitive to initial conditions (SIC). It means that if the initial state of a chaotic system is changed by a very small amount, the resulting orbit diverges exponentially from the original orbit. In fact, the two orbits become un-correlated after the passage of a fair amount of time. This SICness of chaotic systems is sometimes called the butterfly effect. The divergence of two orbits of the logistic map can be seen in the following temporal plot.
The graphs that we saw above show the temporal development of the orbit. However, when we refer to the "state" of a system being a fixed-point or an n-cycle or chaotic, we are actually referring to the long-term state of the system, after the initial transient dynamics have ceased. If we plot only the long-term state of the system versus the parameter a, the resulting plot is known as a bifurcation diagram or a Feigenbaum diagram. We can generate such plots from computer simulations, by simply discarding, say, first 100 temporal points and plotting the remaining. The bifurcation diagram for the logistic map is as follows.

Fixed points, period-doubling bifurcations and cascades are obviously seen in the bifurcation diagram. It is seen that chaotic orbits fill up entire intervals of values in the diagram. The region from the second period-doubling bifurcation can be magnified to observe the richness of the dynamcs.
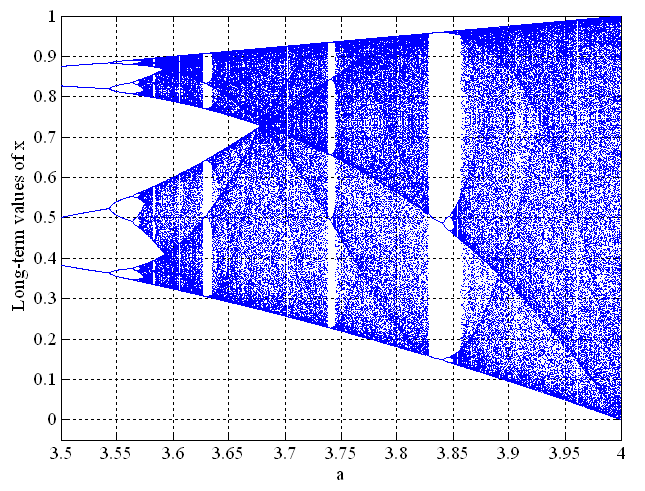
From the above bifurcation diagram, we can observe that the regimes of chaotic dynamics are interspersed with brief regimes (or "windows") of periodicity - a phenomenon known as intermittency.
The logistic map is only one of the many dynamical systems that display deterministic chaos. Some of the other dynamical systems are:
Discrete-time maps:
The Tent Map
The Renyi Map
The Kaplan-Yorke Map
The Henon Map
Continuous-time flows:
- The Lorenz System
- The Rossler System
A brief introduction to a few other discrete-time maps.
An overview of chaos in continuous-time flows.
Keep watching these pages!!